


The Data Analytics Conferences Guide 2023/2024 is your one-stop shop for conferences you actually want to go to. These are great conferences in cool cities.
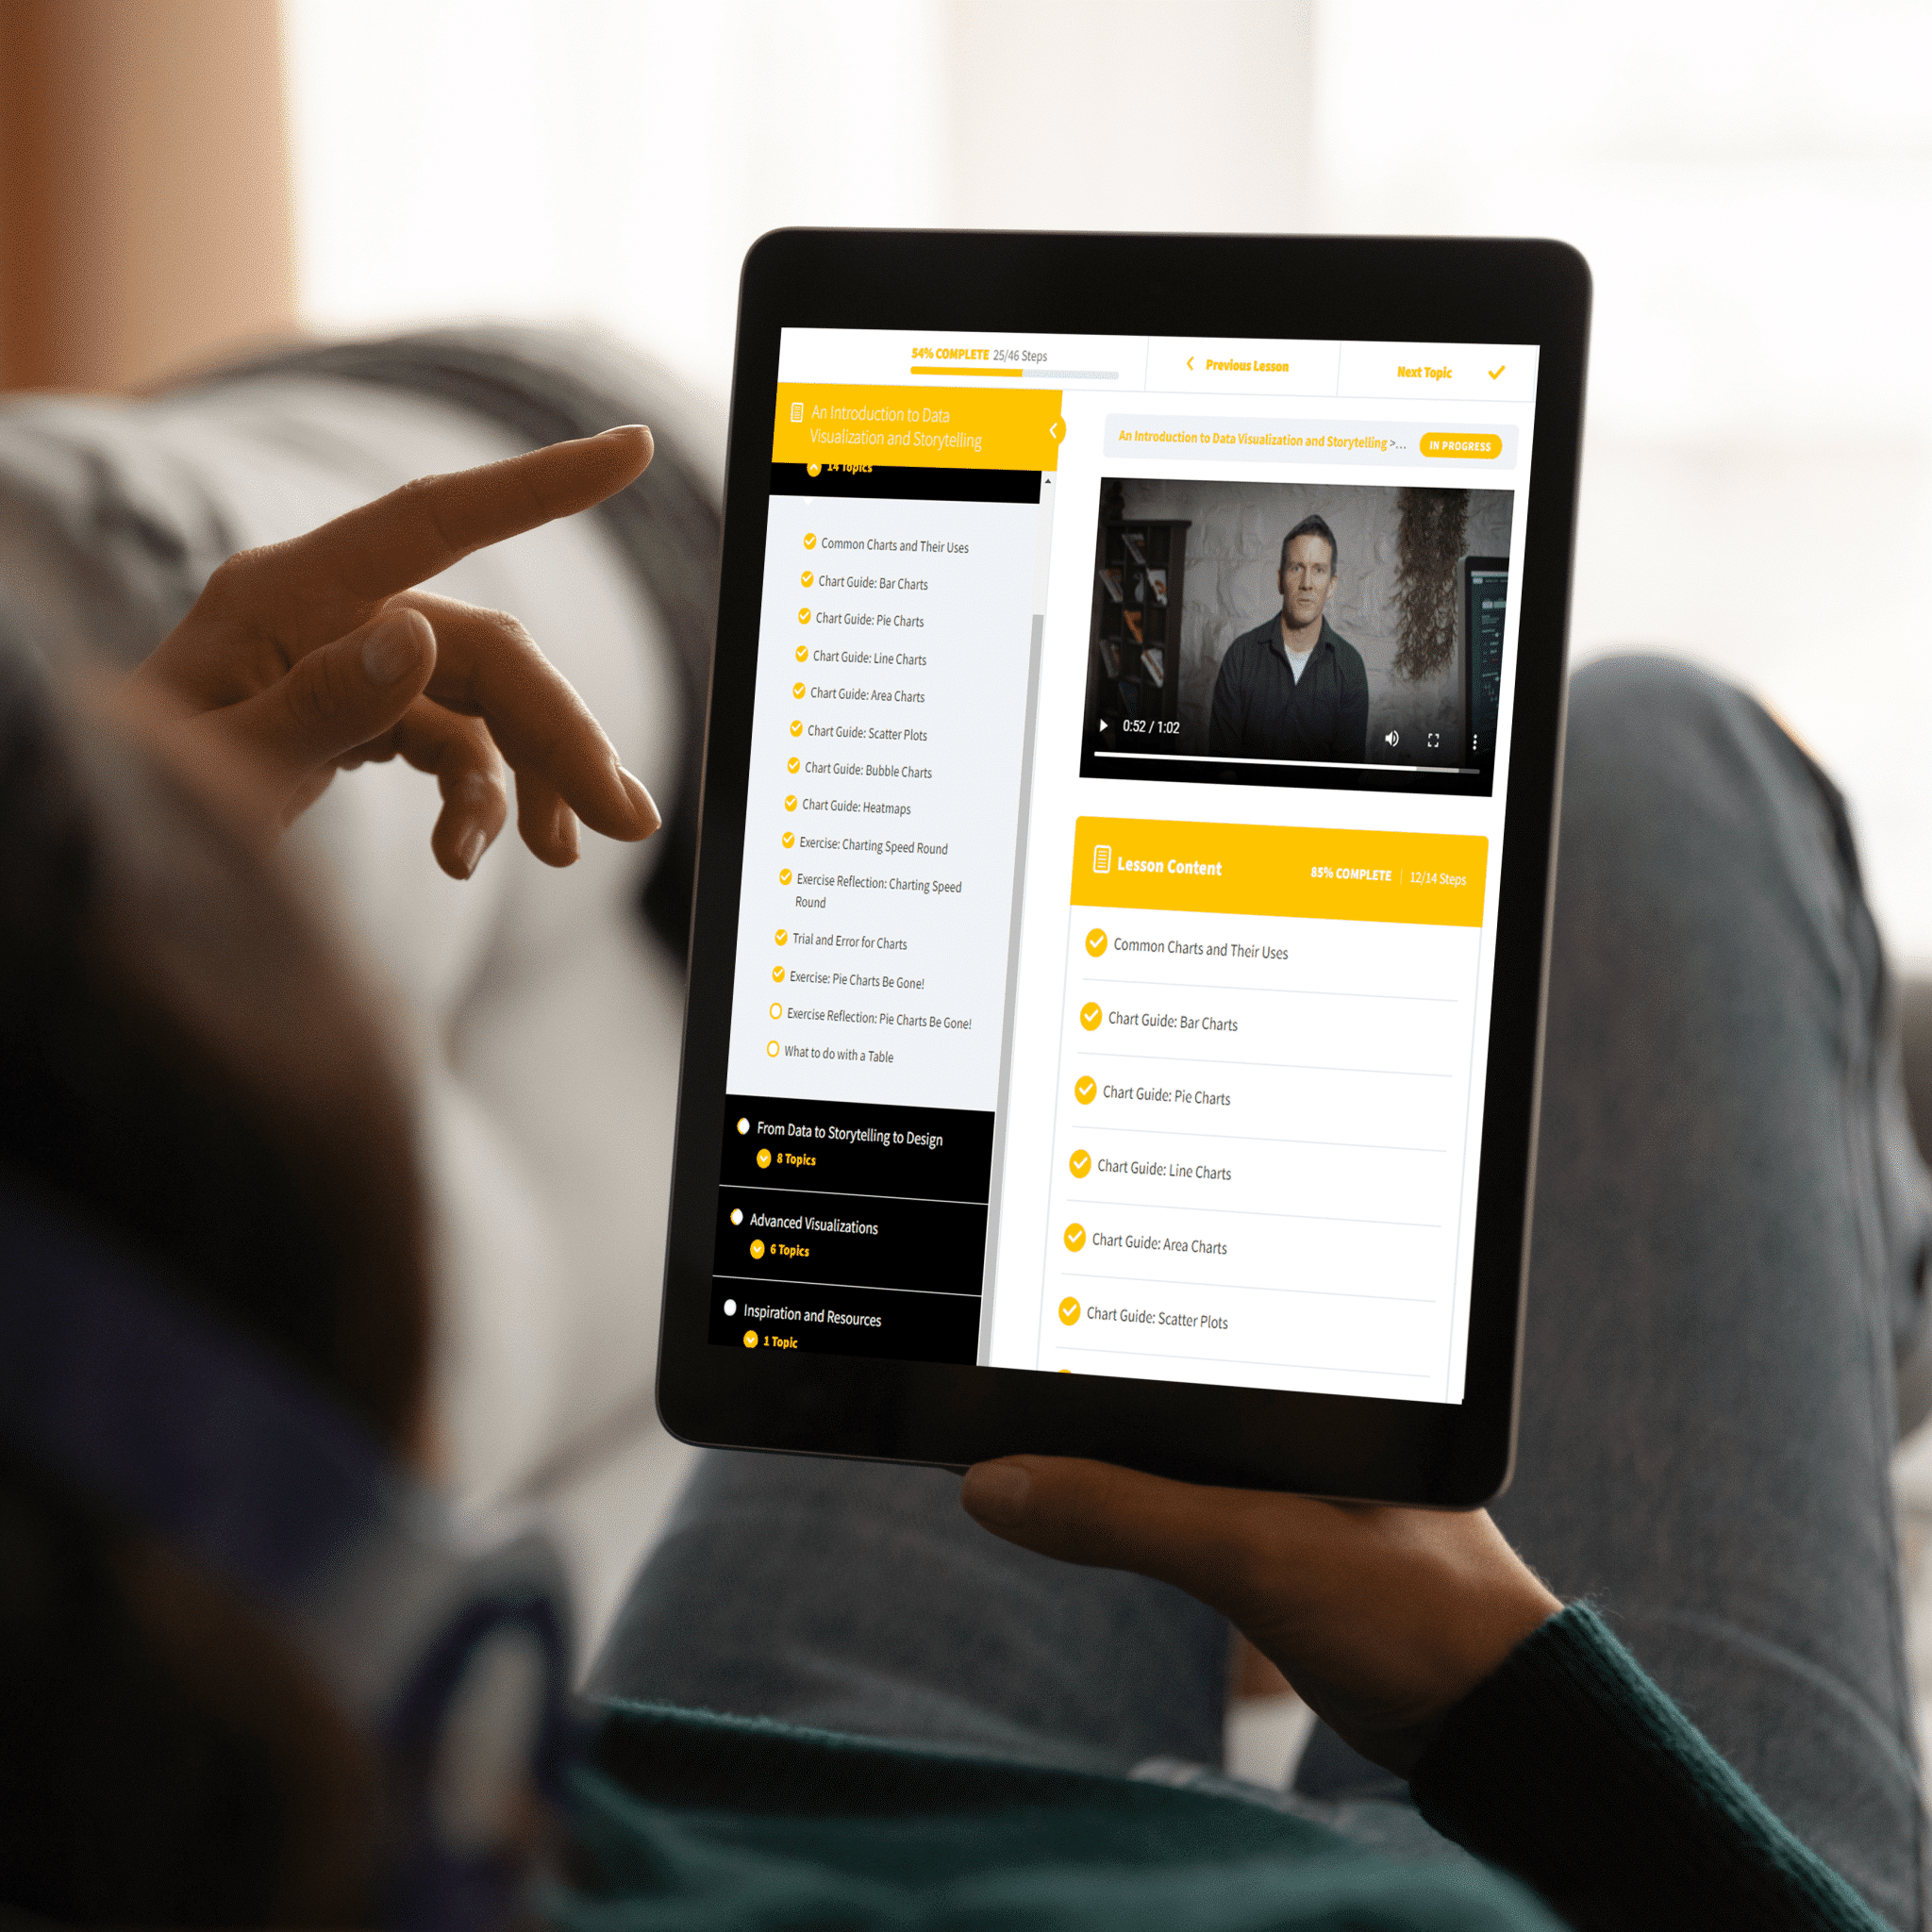
As a strategic data visualization agency, we want two things: better design skills in the corporate world and the government sector, and for our clients to learn the necessary skills from us and be able to do visualize their own data forevermore. Building strategic capabilities in data visualization is teaching a team or a company to fish. To design better presentations, visual reports, and infographics themselves. To get it right, understandable, and ‘easy on the eye’ the first time. We don’t want to sit our clients’ laps too long, to overstay our welcome.


